Denser Environments Cultivate Larger Galaxies

A Comprehensive Study beyond the Local Universe with 3 Million Hyper Suprime-Cam Galaxies

Image
									depicting the main question of the paper -- If we take two galaxies of 
									the same mass and morphology in different environments, which is larger?

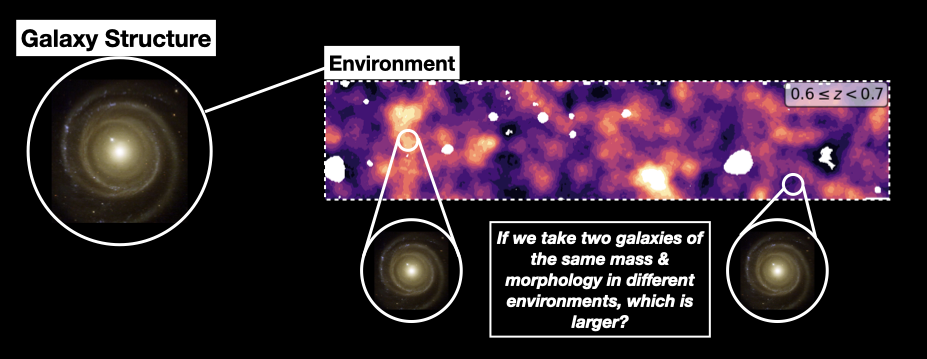
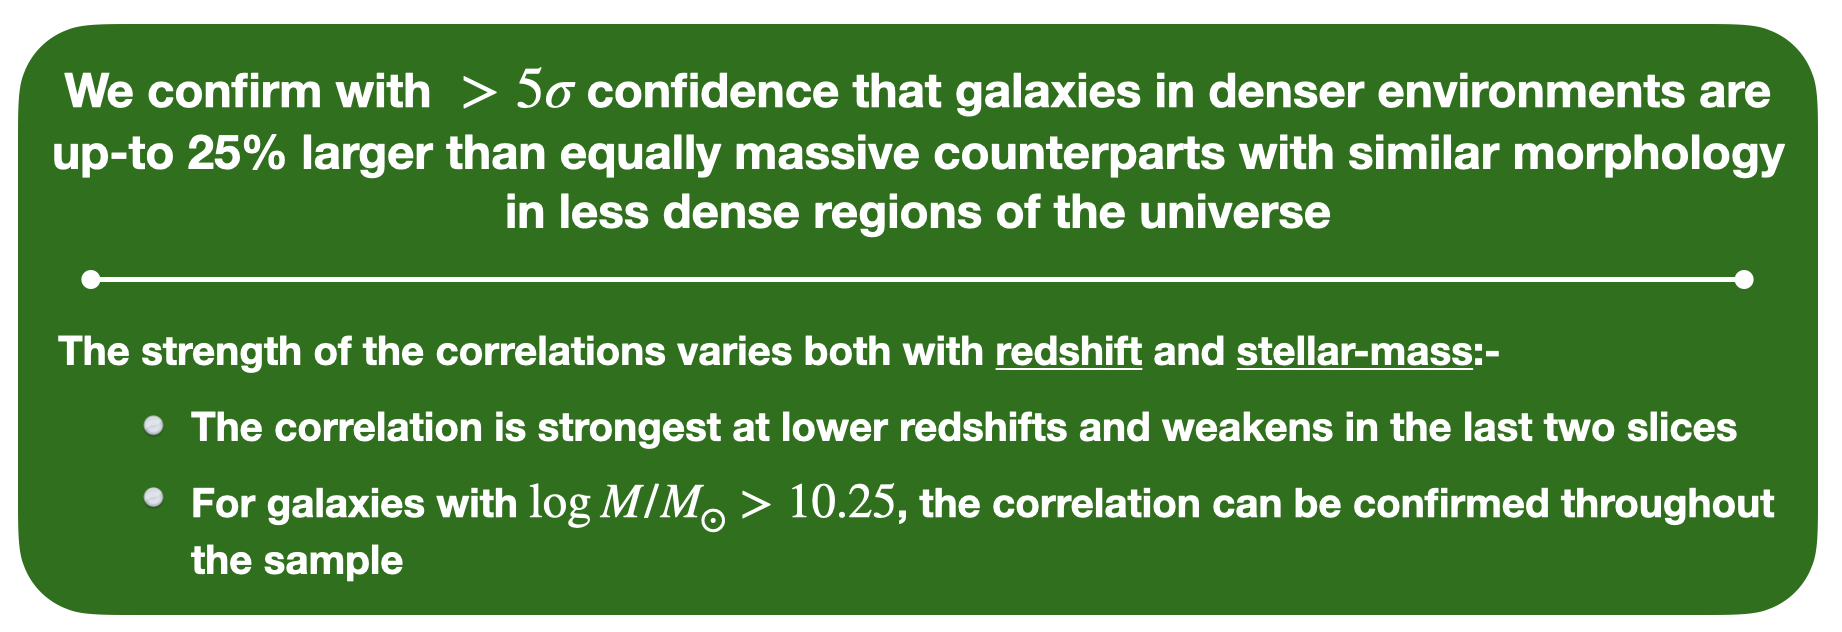
Quick Summary: We used a sample of $\sim3$ million Hyper Suprime-Cam galaxies to demonstrate with $>5\sigma$ confidence that galaxies in denser environments are upto $\sim25\%$ larger than their counterparts with similar mass and morphology in less dense regions of the universe. This comprehensive study is an important step in resolving decades of contradictory results on this topic. It also sheds new light on how the structure of galaxies is connected with their dark matter halos; as well as their merger history.

Recorded Talk: Rubin Community Workshop
The Power of ML & Robust Statistics in Galaxy Evolution: from HSC to LSST


Why did we do this work?

Image
									showing how the the structure of a galaxy changes almost at every step 
									in the hierarchical model of galaxy formation. The structure of a galaxy changes almost at every step in the hierarchical model of galaxy formation. Thus, the correlation of galaxy structure with environment acts as a powerful probe of both dark matter halos and the baryonic processes within them. Illustrations adapted from Science

The relationship between galaxy size and environment has remained enigmatic despite being studied for more than a decade, with no broad consensus in the field. Different studies have reported wildly conflicting results beyond the local Universe ($z \geq 0.2$), as summarized in the Table below. While some studies have reported a positive correlation of radius with the environment for certain subpopulations of galaxies; others have reported no correlation; and yet others have reported a negative correlation.

Image of 
									a table showing how different studies
									have reported wildly conflicting results. While some studies have reported a positive correlation
									of radius with the environment for certain subpopulations of galaxies; others have reported 
									no correlation; and yet others have reported a negative correlation.

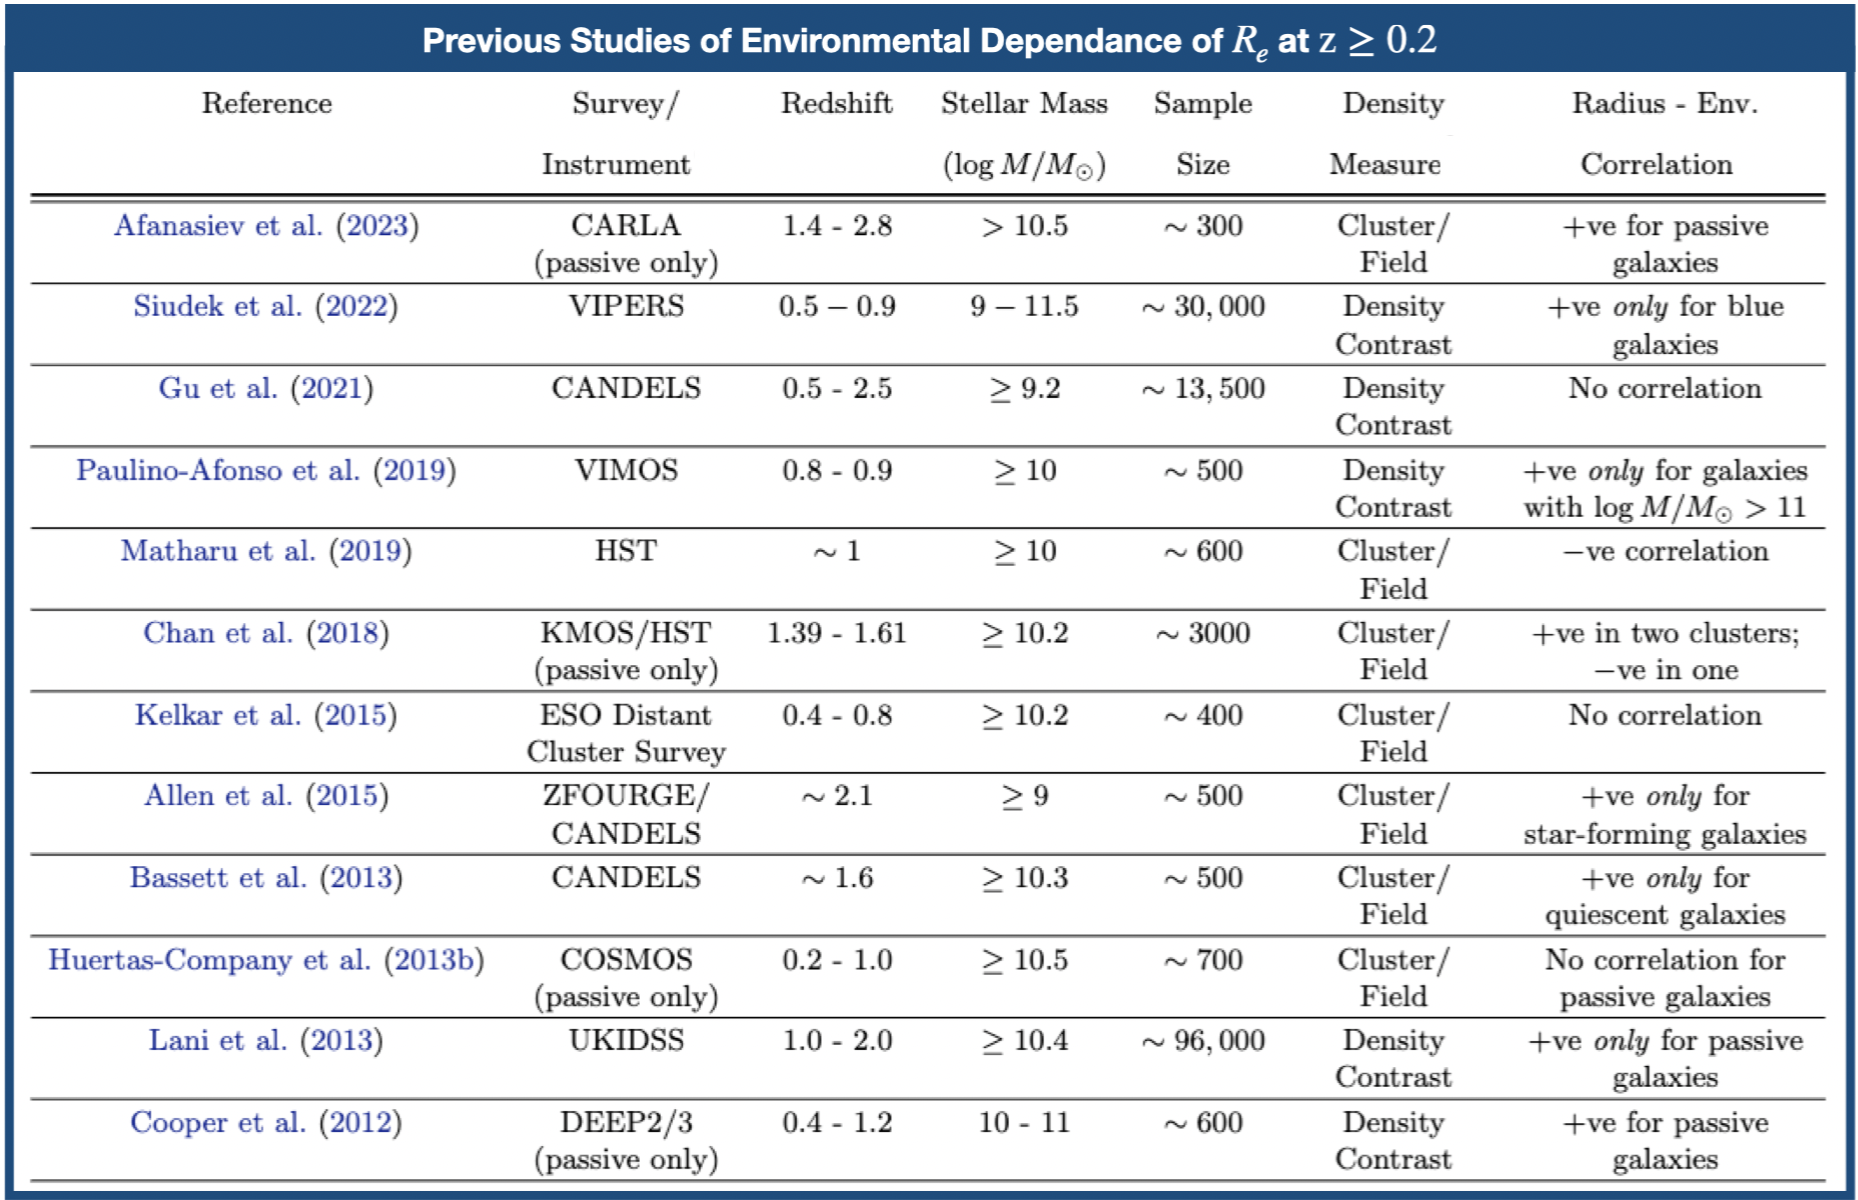
These conflicting results are primarily driven by:-

  • Small Sample Sizes
  • Absence of Robust Uncertainty Estimates on $R_e$
  • Not Using Statistically Robust Techniques to Determine Correlation
  • Not Properly Controlling for Nuisance Parameters (e.g., stellar mass, morphology)
To properly tackle this challenge, we need a large uniform sample of galaxies with accurate $R_e$ measurements and associated uncertainties, as well as a statistically robust technique to determine the correlation.


What Did we Do?

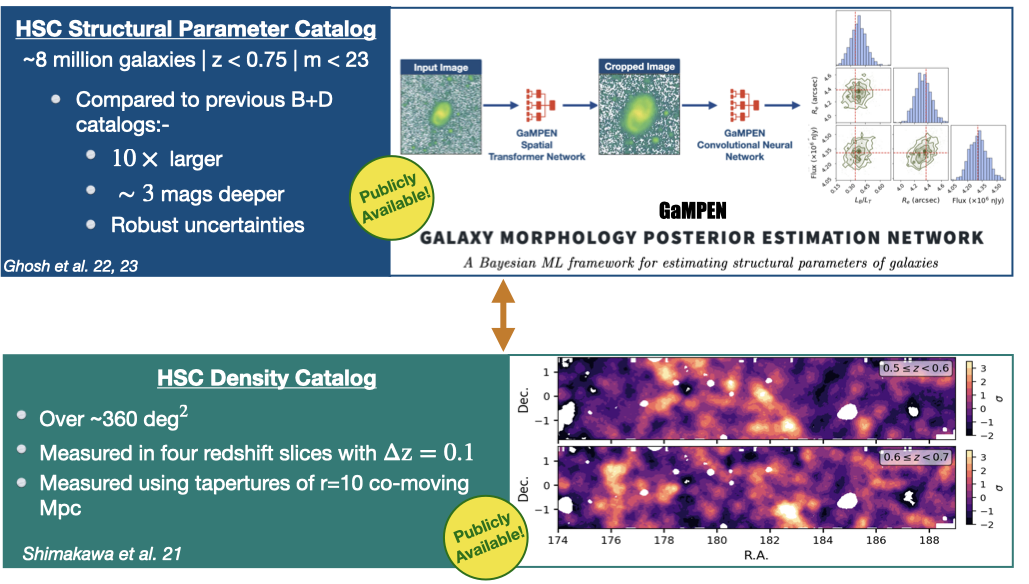
In order to tackle the challenge outlined above, we correlated two publicly available catalogs --- the Hyper Suprime-Cam (HSC) structural parameter catalog with the HSC environmental density catalog to create a sample of 3 million HSC galaxies at $ 0.3 \leq z < 0.7 $ with $m < 23$ and $ \log M/M_{\odot} \geq 8.9 $. Compared to previous studies, this overlapping sample is $\sim100-10,000$ times larger and goes $\sim1$ dex deeper in mass-completeness. Image depicting
									that we correlated the HSC structural parameter catalog from Ghosh et al
									with the environmental density catalog from Shimakawa et al.


What Did we Find?

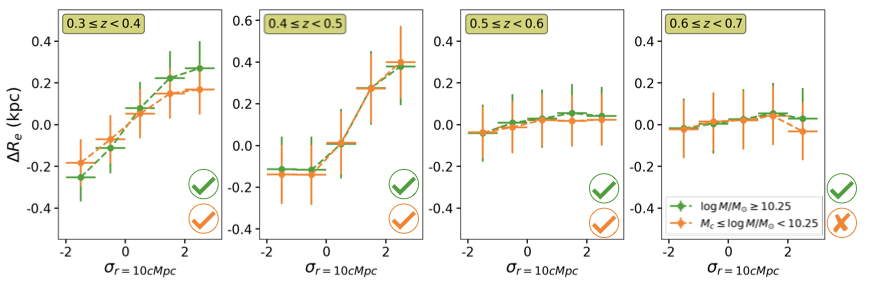
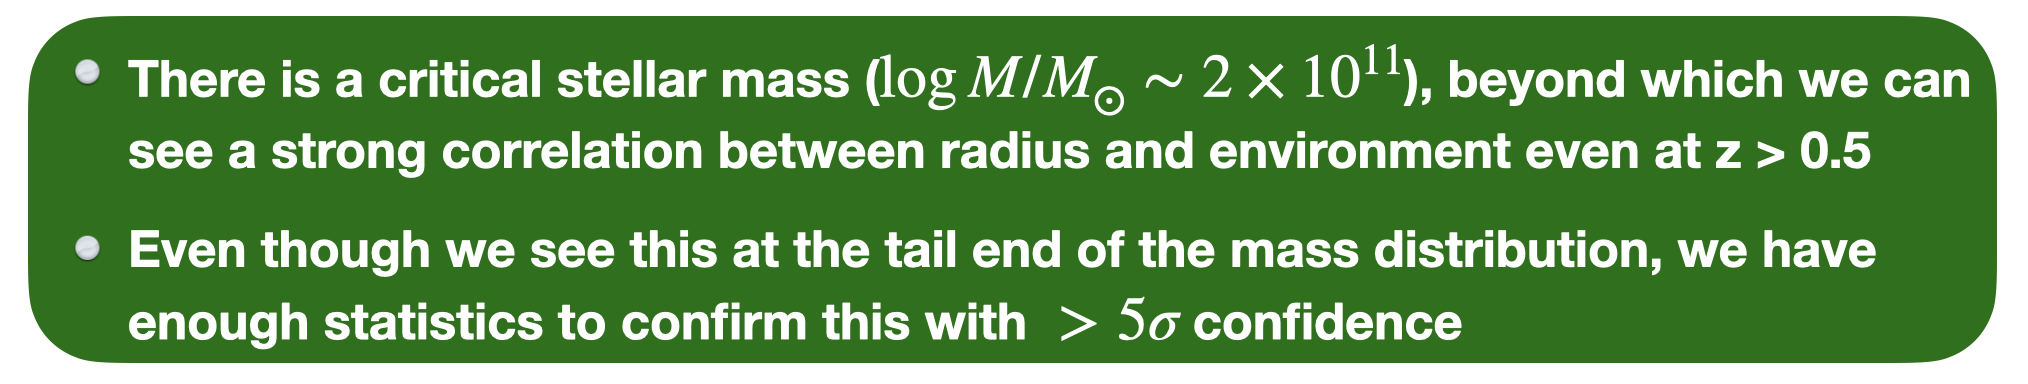
First, we correlate the deviation in effective radius from the average size, $ \Delta R_e = R_e - \overline{R_e}(M,L_B/L_T) $, against density excess measured using a top-hat of 10 co-moving Mpc ($\sigma_{r=10\,{\rm cMpc}}$). We perform the measurement separately in four different redshift slices.

Effective radius ($R_e$) 
									and deviation in effective radius from the average size,
									 $\Delta R_e = R_e - \overline{R_e}(M,L_B/L_T)$, 
									 \are plotted against density excess ($\sigma_{r=10\,{\rm cMpc}}$). Checkmarks in the figure denote cases where we can reject the null-hypothesis of no correlation at $ > 5\sigma $ confidence. To judge the presence of correlations while taking into account the $R_e$ posterior distribution of each single galaxy, we use a Monte Carlo-based Spearman rank correlation test. We confirm with more than five sigma confidence that galaxies in denser environments 
									are up-to 25 percent larger than equally massive counterparts with similar morphology 
									in less dense regions of the universe. The strength of the correlations varies both with 
									redshift and stellar-mass. The correlation is strongest at lower redshifts and weakens 
									in the last two slices. For galaxies with higher masses, the correlation can be confirmed 
									throughout the sample

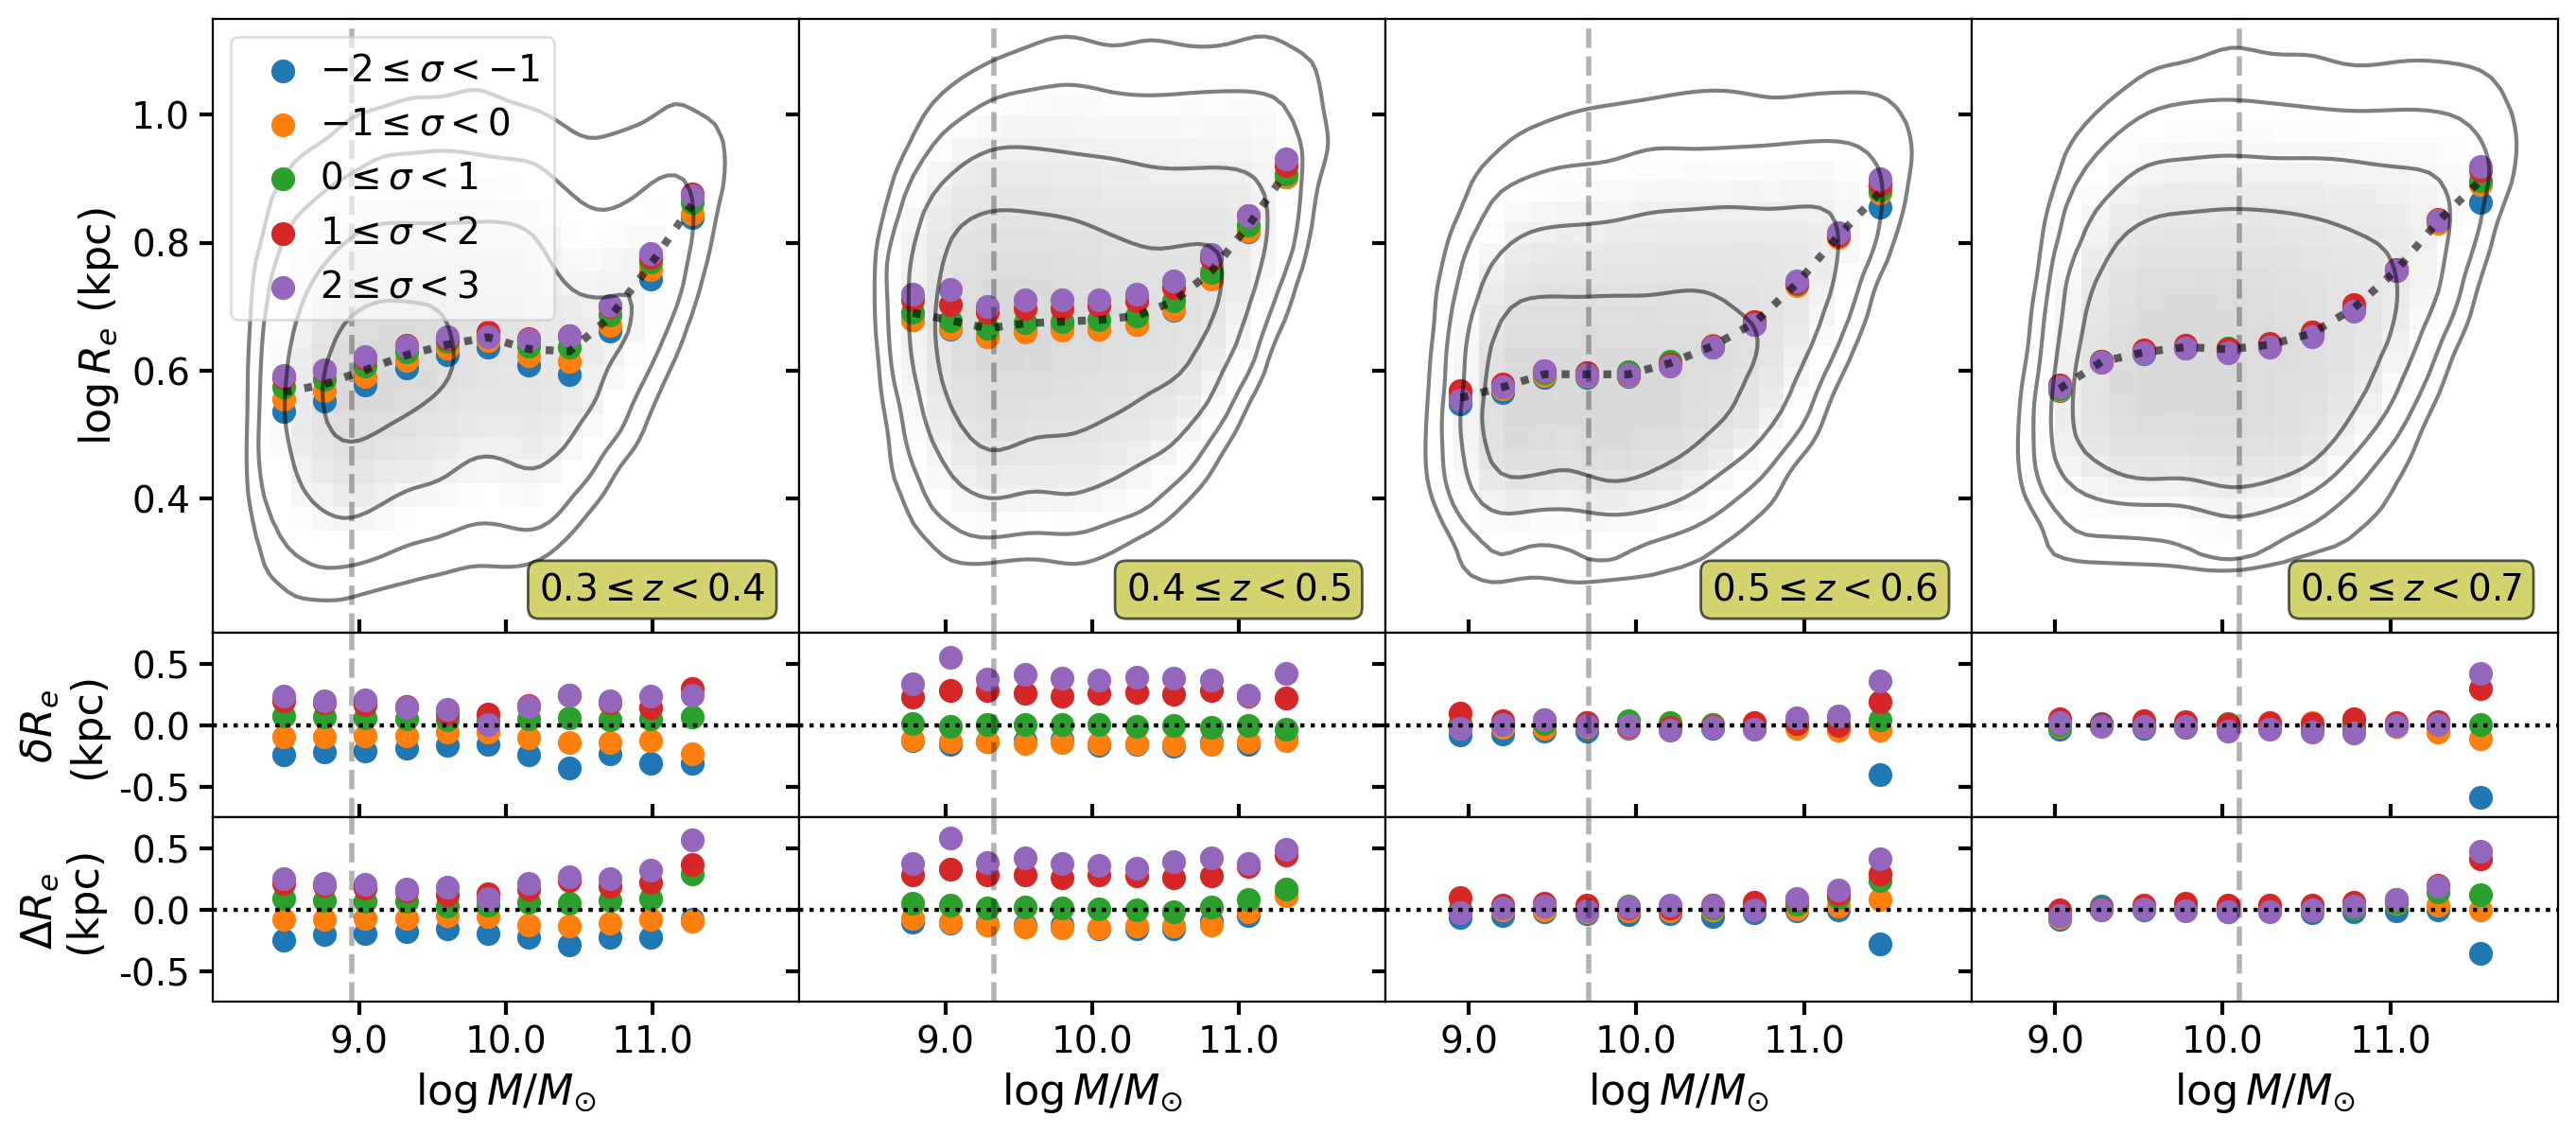
An alternative way to answer our primary question is to investigate the size-mass relationship for galaxies in different environments. Therefore, we performed a size-mass analysis for our entire sample.

Plot 
									of the size-mass relationship for the four different redshift slices. The size-mass relationship for the four different redshift slices. The colored points in the top panels depict the median effective radius at a given stellar mass for all galaxies within a given density excess bin (as shown in the figure legend). The contours and shading in the top panels delineate denser regions of the size-mass plane, and the black dotted lines running alongside the colored points show the overall trend. The second row shows how the colored points deviate from the overall median (black dotted) trend line in the top row, i.e., $ \delta R_e = R_e - \overline{R_e}(M) $. The bottom panels show the median values of $ \Delta R_e = R_e - \overline{R_e}(M,L_B/L_T) $ for galaxies in different environments at a given stellar mass. The gray dashed vertical lines throughout the figure show the overall mass-completeness in each redshift slice. There is a critical stellar mass beyond which we can see a strong 
									correlation between radius and environment even at redshifts greater than 0.5.
									Even though we see this at the tail end of the mass distribution, 
									we have enough statistics to confirm this with more than five sigma confidence

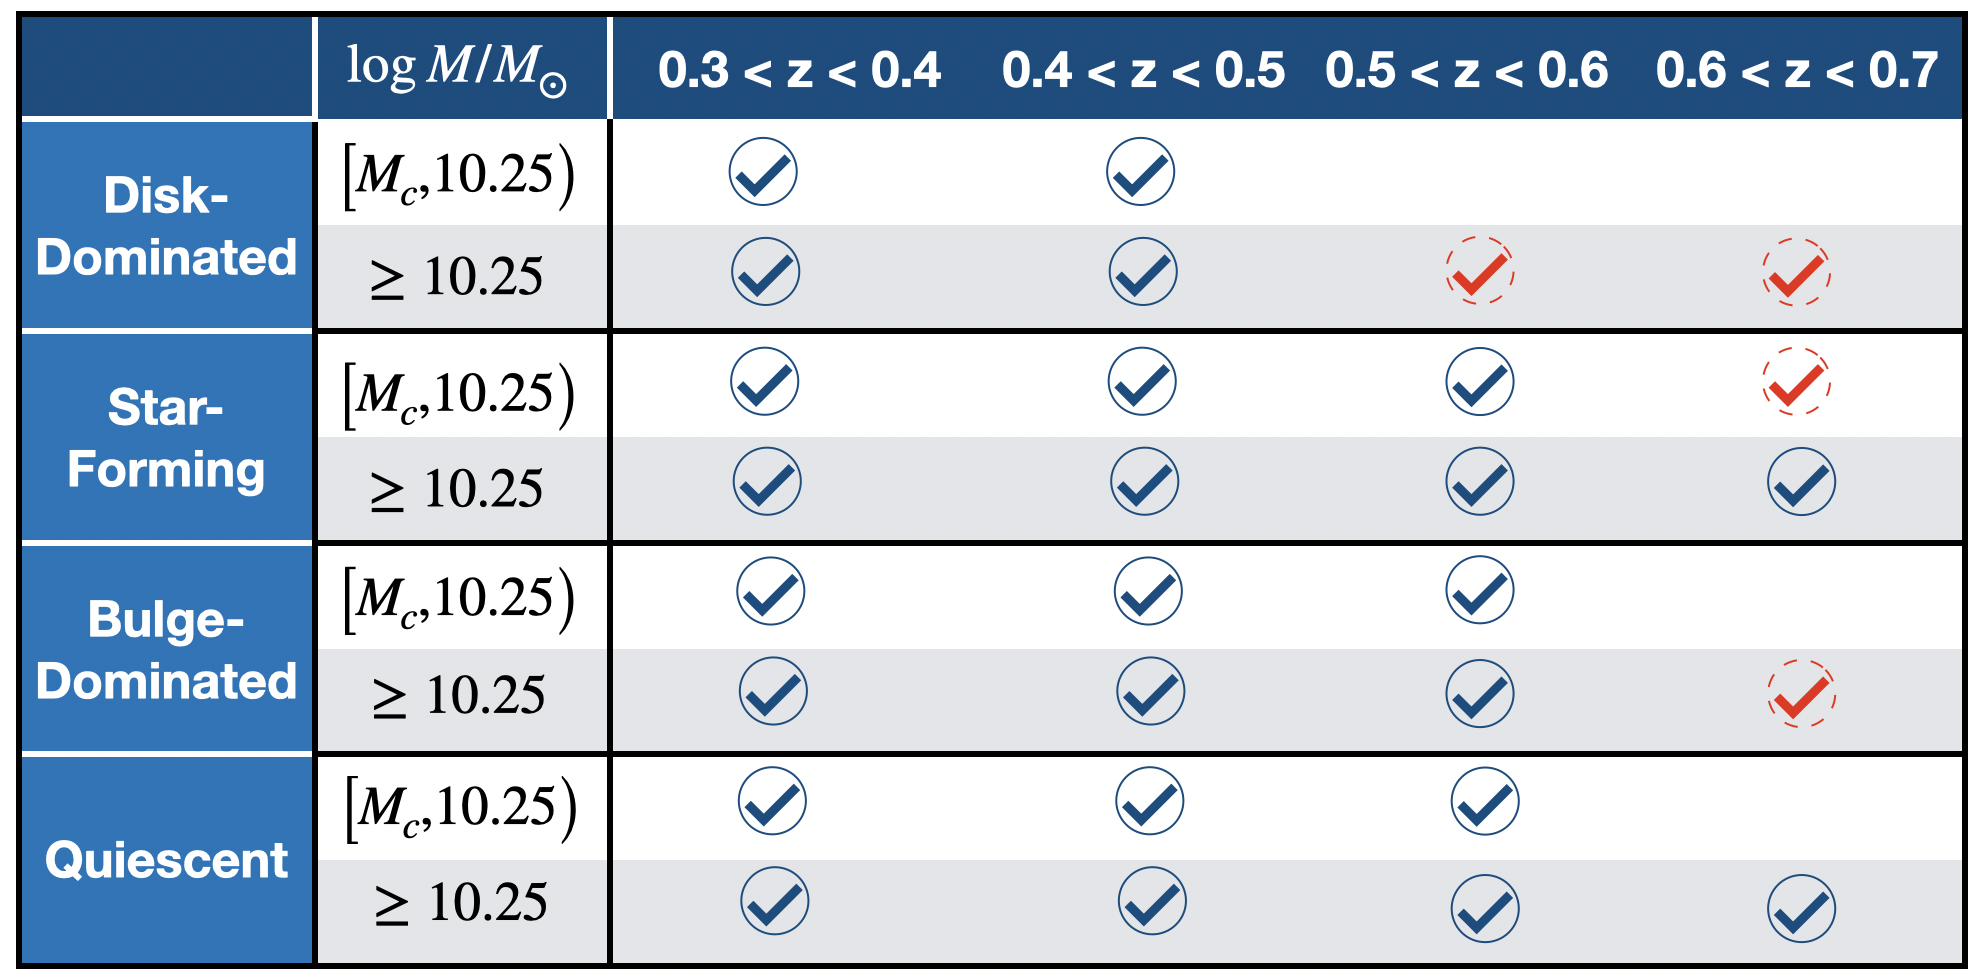
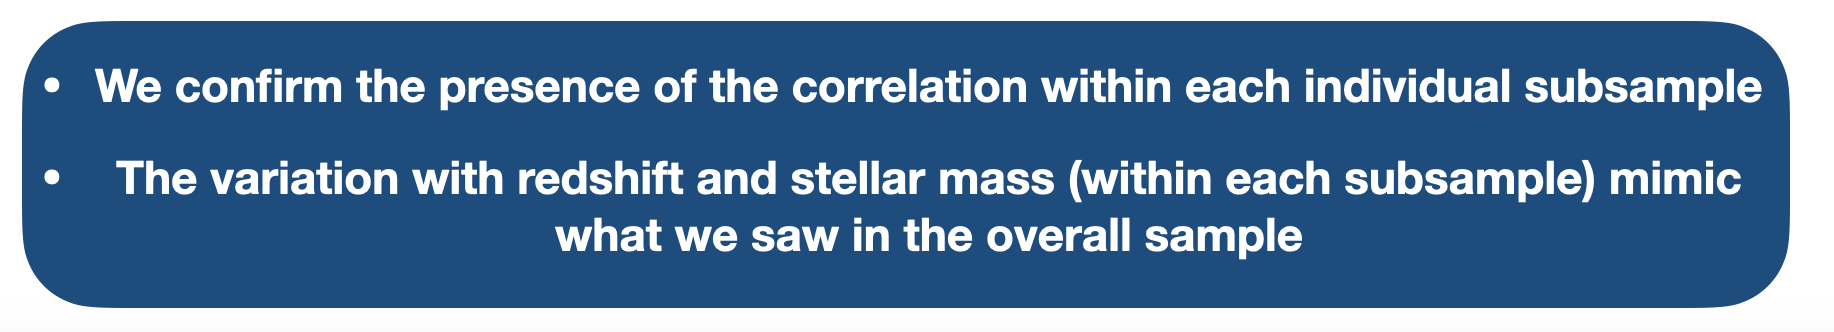
We also investigated the presence of the correlation separately for different subpopulations of galaxies and the results are shown in the table below.

Table
									showing the results of running the correlation analysis on different 
									subpopulations of galaxies Blue checkmarks denote cases where we can reject the null-hypothesis of non-correlation with a confidence $ >> 5 \sigma$. Red checkmarks denote cases where the confidence-levle is $ \gtrsim 5 \sigma. $ We confirm the presence of the correlation within each individual subsample.
									The variation with redshift and stellar mass (within each subsample) mimic 
									what we saw in the overall sample.

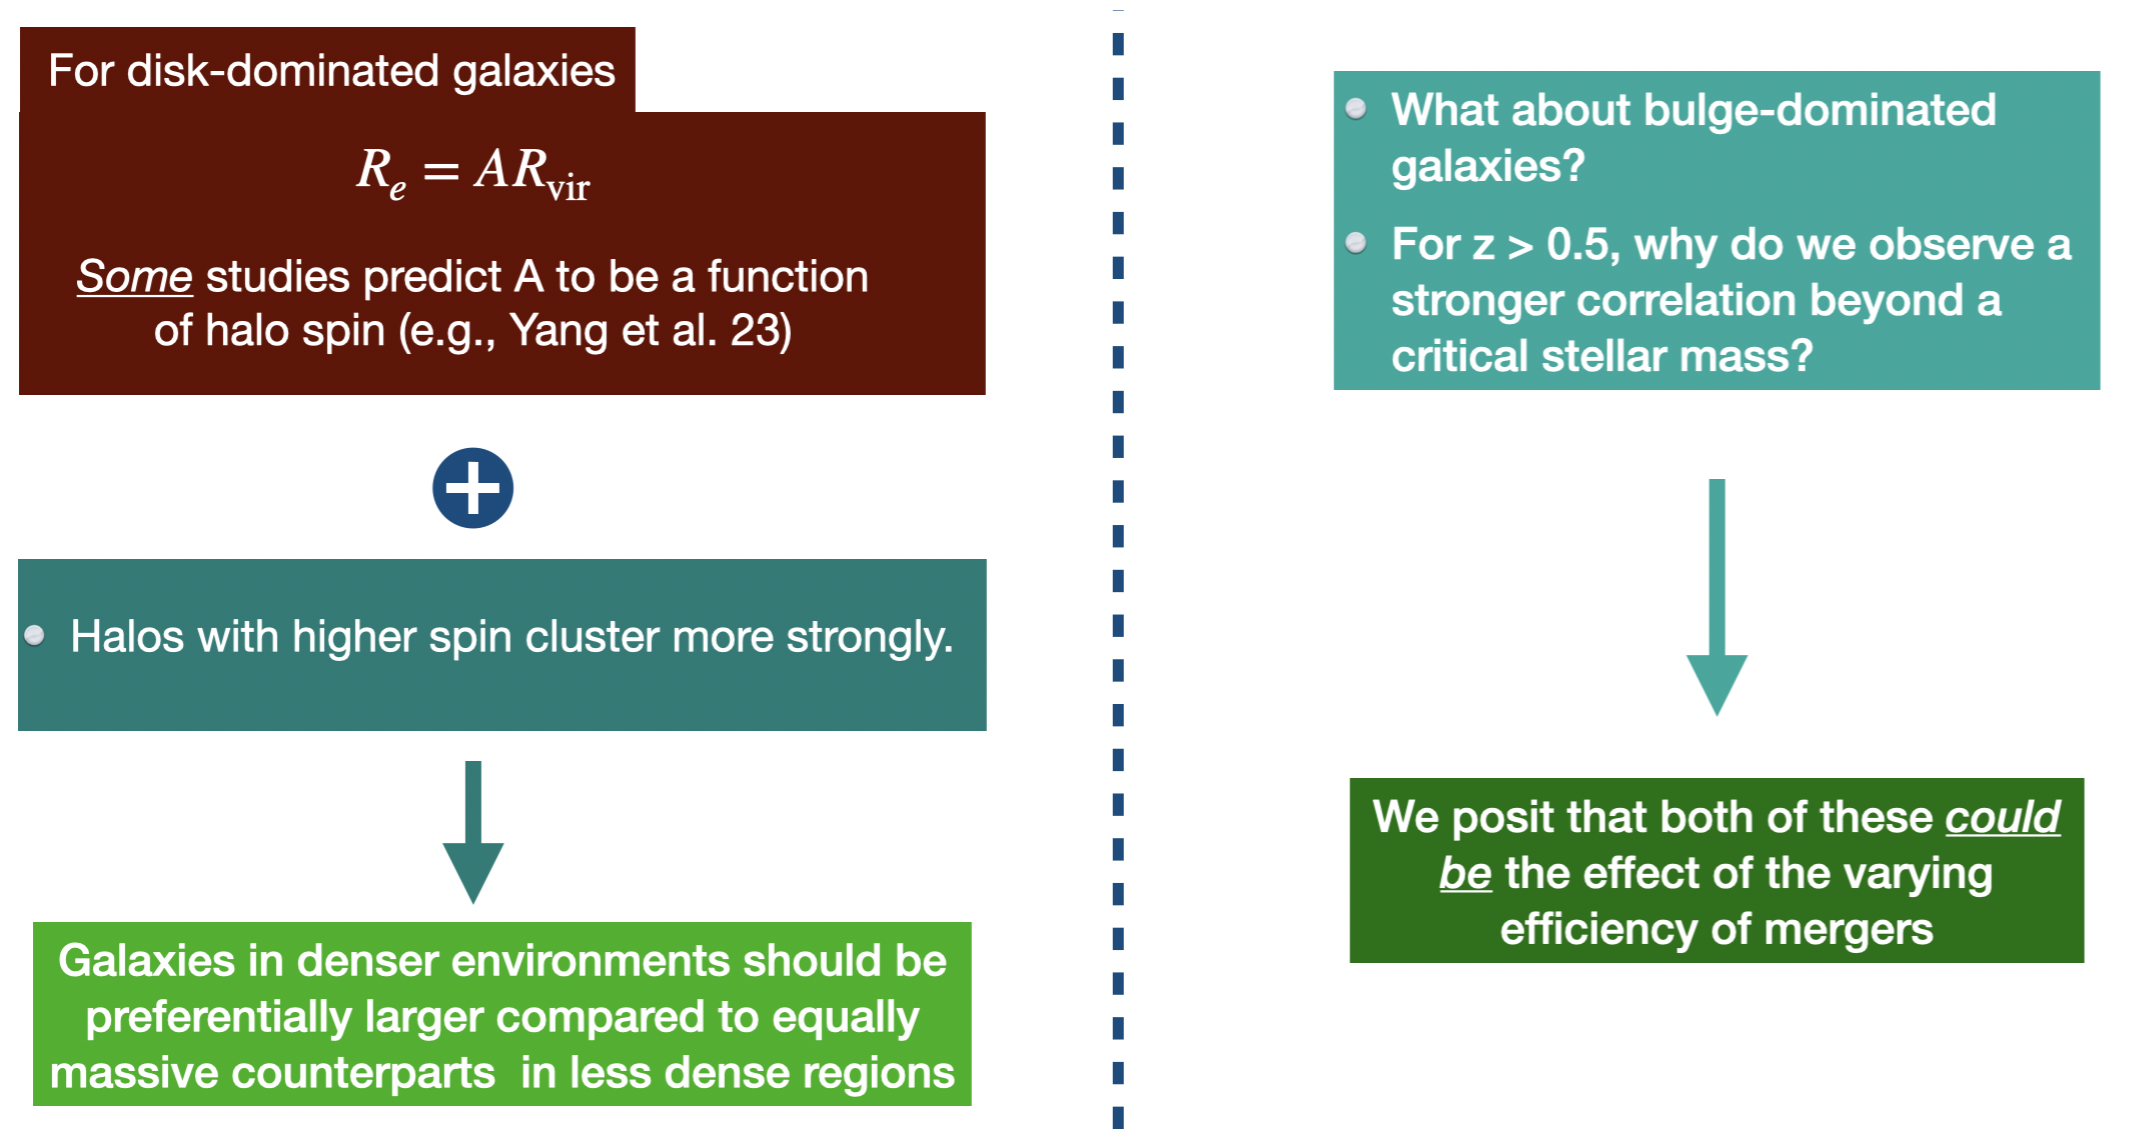
What Do Our Results Imply?

There is substantial disagreement among theoretical predictions 
									and no trivial explanation for the observed correlations. 
									Extensive comparative studies using simulations is needed to 
									definitively establish the reason for our observed correlations. However, below, we outline some possible explanations for the observed correlations:- Image outlining possible explanations for the observed correlations.